3,998 people live in Running Springs, where the median age is 42.2 and the average individual income is $34,223. Data provided by the U.S. Census Bureau.
Total Population
Median Age
Population Density Population Density This is the number of people per square mile in a neighborhood.
Average individual Income
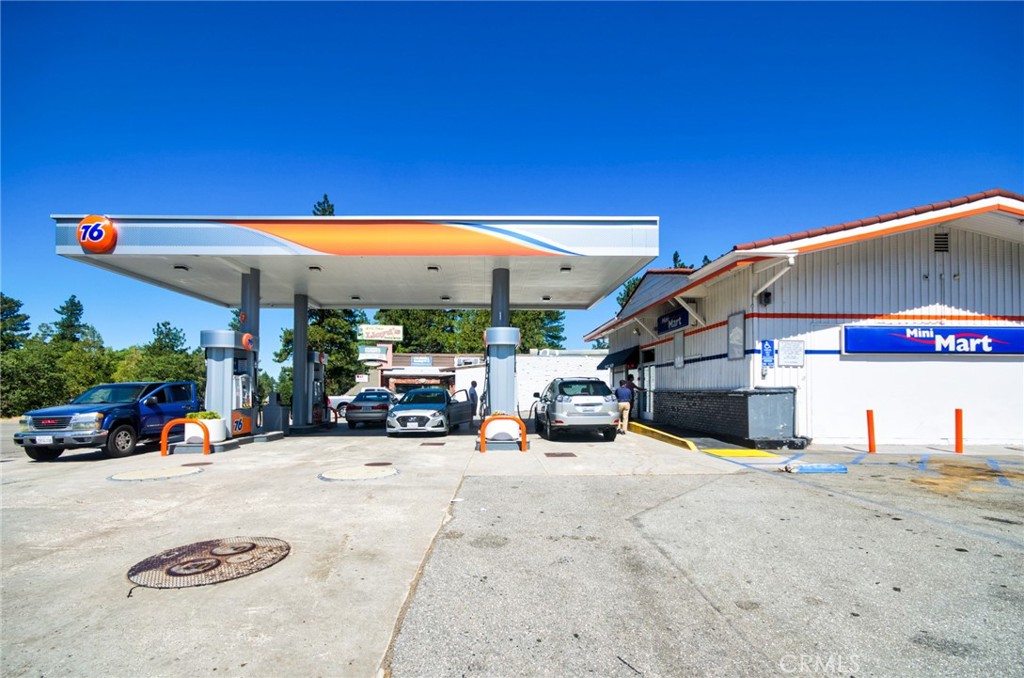
There's plenty to do around Running Springs, including shopping, dining, nightlife, parks, and more. Data provided by Walk Score and Yelp.
Explore popular things to do in the area, including Littlebear Bottleshop, Juniper Moon, and The Sugar Chalet.
| Name | Category | Distance | Reviews |
Ratings by
Yelp
|
|---|---|---|---|---|
| Dining | 4.1 miles | 17 reviews | 5/5 stars | |
| Dining | 0.55 miles | 13 reviews | 5/5 stars | |
| Dining | 0.68 miles | 8 reviews | 5/5 stars | |
| Active | 4.08 miles | 8 reviews | 5/5 stars | |
| Active | 2.36 miles | 20 reviews | 5/5 stars | |
| Nightlife | 3.48 miles | 8 reviews | 5/5 stars | |
| Beauty | 0.65 miles | 8 reviews | 5/5 stars | |
| Beauty | 1.66 miles | 16 reviews | 5/5 stars | |
| Beauty | 4.1 miles | 25 reviews | 5/5 stars | |
|
|
||||
|
|
||||
|
|
||||
|
|
||||
|
|
||||
|
|
Running Springs has 1,580 households, with an average household size of 2.53. Data provided by the U.S. Census Bureau. Here’s what the people living in Running Springs do for work — and how long it takes them to get there. Data provided by the U.S. Census Bureau. 3,998 people call Running Springs home. The population density is 950.97 and the largest age group is Data provided by the U.S. Census Bureau.
Total Population
Population Density Population Density This is the number of people per square mile in a neighborhood.
Median Age
Men vs Women
Population by Age Group
0-9 Years
10-17 Years
18-24 Years
25-64 Years
65-74 Years
75+ Years
Education Level
Total Households
Average Household Size
Average individual Income
Households with Children
With Children:
Without Children:
Marital Status
Blue vs White Collar Workers
Blue Collar:
White Collar:
We pride ourselves in providing personalized solutions that bring our clients closer to their dream properties and enhance their long-term wealth. Contact us today to find out how we can be of assistance to you!